> For the complete documentation index, see [llms.txt](https://ykkim.gitbook.io/wiki/llms.txt). Markdown versions of documentation pages are available by appending `.md` to page URLs; this page is available as [Markdown](https://ykkim.gitbook.io/wiki/industrial-ai/bearingfault_journal/envelope-extraction.md).
# Envelope Extraction based
## Diagnostics 101: A Tutorial for Fault Diagnostics of Rolling Element Bearing Using Envelope Analysis in MATLAB
### Bearing Diagnostics
* Fault signal given by amplitude modulation

위 현상은 Amplitude Modulation(AM)(아래)과 같은 원리


* Simulation of fault signal
실제 베어링 신호와 비슷한 신호 만들기
* Fault Signal + Resonance Signal = Modulated Signal

```
$$
\eqalign{
& x_1 (t) = A\exp ( - \alpha t') & where\,t' = \bmod (t,1/f_f ) \cr
& x_2 (t) = \sin (2\pi f_r t) & where\,f_r = 600Hz \cr
& x_3 (t) = x_1 (t)*x_2 (t) \cr}
$$
```
* Modulated signal + Noise(Discrete, White) = Raw Signal

$$
x(t) = x\_3 (t) + x\_4 (t) + x\_5 (t)
$$
```
Discrete Signal: 기어, 샤프트 등에서 발생하는 노이즈
```
### Diagnosis Using Simulation Data
* 목적: 노이즈가 섞인 raw signal에서 fault information만 추출하는 것
* 3 steps
* discrete signal 분리
* 다른 요소들의 신호를 없애기 위함
* Autoregressive model 적용
* demodulation band selection
* resonance freq.를 포함한 band를 찾아서 band-pass filter를 만듦
* SK와 STFT 사용
* envelope analysis
* original fault signal을 찾기 위함
* Hilbert transform 적용
* Discrete signal seperation
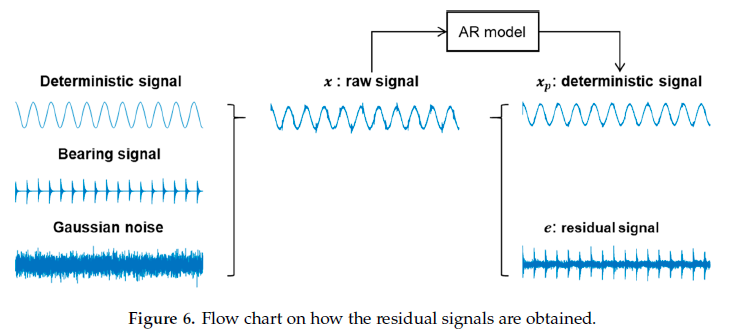
* AR 모델을 사용해서 deterministic signal과 residual signal을 분리했다
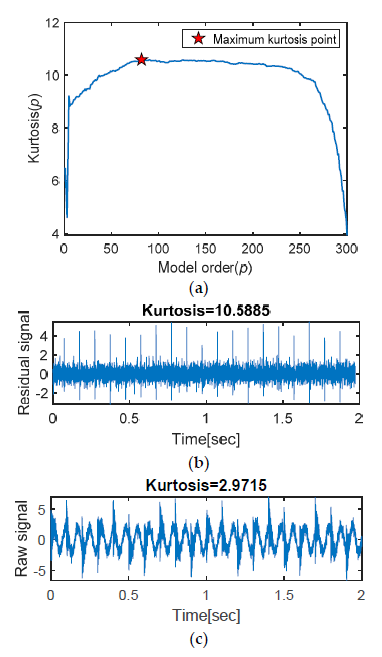
 * AR model의 order는 residual signal의 kurtosis가 최대가 되는 값으로 정한다
 * Demodulation Band Selection
* residual signal에서 resonance frequency를 포함하는(?) frequency band를 찾는다
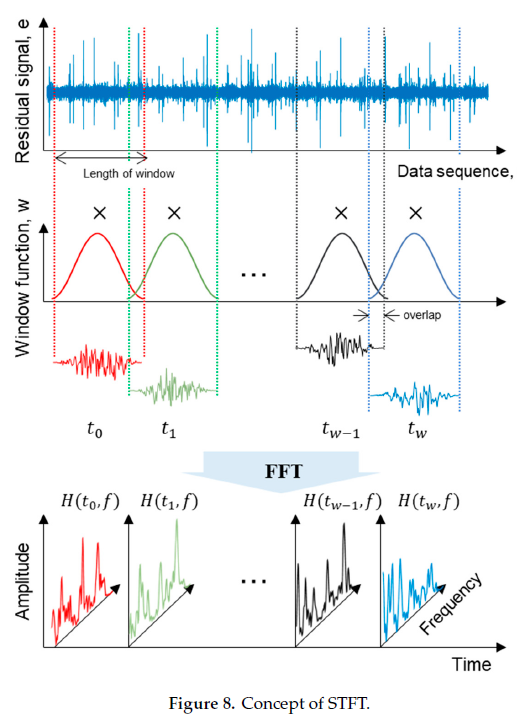
* spectral kurtosis: time-frequency diagram에서 각 주파수에서의 kurtosis, STFT으로 정의됨
* Demodulation Band Selection
* residual signal에서 resonance frequency를 포함하는(?) frequency band를 찾는다
* spectral kurtosis: time-frequency diagram에서 각 주파수에서의 kurtosis, STFT으로 정의됨
 $$
K(f) = {{\left\langle {\left| {S(t,f)} \right|^4 } \right\rangle } \over {\left\langle {\left| {S(t,f)} \right|^2 } \right\rangle ^2 }} - 2
$$
S(t,f) : residual signal의 STFT
* 이 논문에서는 Hann window를 사용함
$$
w(l) = 0.5\left( {1 - \cos \left( {2\pi {1 \over {L - 1}}} \right)} \right),,0 \le l \le L - 1
$$
* 여기서 window length는 fault interval이 0.1초(n=300)로 눈에 보이기 때문에 이것보다 짧아야함
* 각각의 윈도우 길이로 SK를 구하면 superposition됨
$$
K(f) = {{\left\langle {\left| {S(t,f)} \right|^4 } \right\rangle } \over {\left\langle {\left| {S(t,f)} \right|^2 } \right\rangle ^2 }} - 2
$$
S(t,f) : residual signal의 STFT
* 이 논문에서는 Hann window를 사용함
$$
w(l) = 0.5\left( {1 - \cos \left( {2\pi {1 \over {L - 1}}} \right)} \right),,0 \le l \le L - 1
$$
* 여기서 window length는 fault interval이 0.1초(n=300)로 눈에 보이기 때문에 이것보다 짧아야함
* 각각의 윈도우 길이로 SK를 구하면 superposition됨
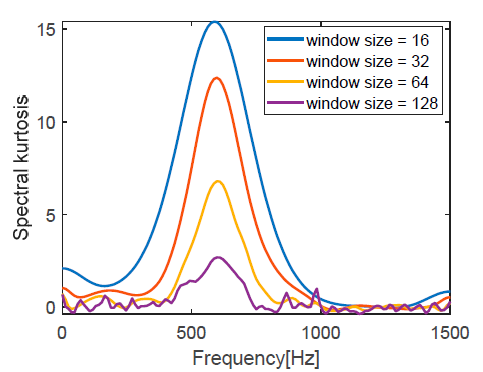 * 공통적으로 freq 500\~700에서 SK가 최대이기 때문에 선정
* Envelope Analysis
* sub-step
1. Hilbert transform
2. Analytic signal의 절대값인 envelope signal을 얻기 위해 Magnitude 계산
3. Envelope signal에 fft를 돌려서 fault freq.를 찾음
* Hilbert transform
* 90 deg phase shifter
$$
a\_x (t) = x(t) + j\hat x(t) = \sqrt {x^2 (t) + \hat x^2 (t)} e^{j\varphi \_x (t)} = A\_x (t)e^{j\varphi \_x (t)}
$$
```
a_x(t) : analytic signal (envelope)
x(t) : 원래 신호
x^(t) : 90도 phase shift된 신호
```
```

a, b: faulty bearing
c, d: healthy bearing
- 원래 신호(아래)와 다르게 나온 이유

: sampling rate가 낮고 AR filtering 때문에 residual signal의 length가 변했기 때문
```
## Rolling Bearing Fault Classification Based on Envelope Spectrum and Support Vector Machine
2008, Lei Guo, Jin Chen, Xinglin Li, Journal of Vibration and Control
### Introduction
### Envelope Spectrum Analysis
* envelope signal = analytic signal의 amplitude
* analytic signal = s(t) + jh(t)
s(t) : original signal
h(t) : hilbert signal
#### Hilbert Transform
* Hilbert transform의 정의 (Boashash, 1992)
$$
h\left( t \right) = H\left{ {s\left( t \right)} \right} = {1 \over \pi }\int\_{ - \infty }^\infty {{{s\left( \tau \right)} \over {t - \tau }}d\tau } = {1 \over {\pi t}}\*s\left( t \right)
$$
* 1/πt의 푸리에 변환은 다음과 같음
* 공통적으로 freq 500\~700에서 SK가 최대이기 때문에 선정
* Envelope Analysis
* sub-step
1. Hilbert transform
2. Analytic signal의 절대값인 envelope signal을 얻기 위해 Magnitude 계산
3. Envelope signal에 fft를 돌려서 fault freq.를 찾음
* Hilbert transform
* 90 deg phase shifter
$$
a\_x (t) = x(t) + j\hat x(t) = \sqrt {x^2 (t) + \hat x^2 (t)} e^{j\varphi \_x (t)} = A\_x (t)e^{j\varphi \_x (t)}
$$
```
a_x(t) : analytic signal (envelope)
x(t) : 원래 신호
x^(t) : 90도 phase shift된 신호
```
```

a, b: faulty bearing
c, d: healthy bearing
- 원래 신호(아래)와 다르게 나온 이유

: sampling rate가 낮고 AR filtering 때문에 residual signal의 length가 변했기 때문
```
## Rolling Bearing Fault Classification Based on Envelope Spectrum and Support Vector Machine
2008, Lei Guo, Jin Chen, Xinglin Li, Journal of Vibration and Control
### Introduction
### Envelope Spectrum Analysis
* envelope signal = analytic signal의 amplitude
* analytic signal = s(t) + jh(t)
s(t) : original signal
h(t) : hilbert signal
#### Hilbert Transform
* Hilbert transform의 정의 (Boashash, 1992)
$$
h\left( t \right) = H\left{ {s\left( t \right)} \right} = {1 \over \pi }\int\_{ - \infty }^\infty {{{s\left( \tau \right)} \over {t - \tau }}d\tau } = {1 \over {\pi t}}\*s\left( t \right)
$$
* 1/πt의 푸리에 변환은 다음과 같음
 * sgn: 어떤 함수의 부호를 출력하는 함수
* 따라서 Hilbert transform은 신호의 amplitude를 input signal의 주파수의 부호에 따라 ±90도 phase shift시켜주는 함수라고 할 수 있음
* analytic signal
$$
z\left( t \right) = s\left( t \right) + jh\left( t \right)
$$
* envelope of the analytic signal
$$
E\left( t \right) = |z\left( t \right)| = |s\left( t \right) + jh\left( t \right)| = \sqrt {s^2 \left( t \right) + h^2 \left( t \right)}
$$
* 고장이 발생하면 envelope spectrum에 고장 특성 주파수가 나타남
*
#### Rolling Bearing Vibration Frequency Features
* 고장 위치에 따른 기본 주파수들
* fr : shaft rotation freq.
* fc : fundamental cage freq.
* fb : ball rotational feq.
* fi : ball pass inner race freq.
* fo : ball pass outer race freq.


### Support Vector Machine
#### Two-Class SVM

* SVM: developed by Vapnik and his co-workers (Vapnik, 2000)
* 커널 함수 Ф(x)를 사용해 original input pattern space (N-dimensional)에서 high dimensional separable feature space(Q-dimensional, Q>N)으로 벡터를 매핑
* 두 개의 데이터셋 사이에 선이나 초평면을 만듦
* 저차원에서 비선형인 문제를 고차원에서 선형 문제로 변환시킬 수 있음
* $$
,\left( {x\_i ,y\_i } \right),,\left( {i = 1,2,...,l} \right),
$$
를 training example이라고 가정하고
$$
x\_i \in R^N
$$
는
$$
y\_i \in \left{ { - 1,1} \right}
$$
에 의해 라벨링 된 클래스에 속함
* 바운더리 H는 다음과 같이 정의됨
$$
w \cdot \Phi \left( x \right) + b = 0
$$
* support vector가 위치한 margin에서 클래스 A와 B의 방정식은 다음과 같음
$$
\eqalign{ & w \cdot \Phi \left( x \right) + b = + 1 \cr & w \cdot \Phi \left( x \right) + b = - 1 \cr}
$$
where vector w defines the boundary
b is a scalar threshold
* 데이터를 가장 잘 나누는 hyperplane은 다음 optimization problem 문제의 solution임(vapnik, 2000)
* sgn: 어떤 함수의 부호를 출력하는 함수
* 따라서 Hilbert transform은 신호의 amplitude를 input signal의 주파수의 부호에 따라 ±90도 phase shift시켜주는 함수라고 할 수 있음
* analytic signal
$$
z\left( t \right) = s\left( t \right) + jh\left( t \right)
$$
* envelope of the analytic signal
$$
E\left( t \right) = |z\left( t \right)| = |s\left( t \right) + jh\left( t \right)| = \sqrt {s^2 \left( t \right) + h^2 \left( t \right)}
$$
* 고장이 발생하면 envelope spectrum에 고장 특성 주파수가 나타남
*
#### Rolling Bearing Vibration Frequency Features
* 고장 위치에 따른 기본 주파수들
* fr : shaft rotation freq.
* fc : fundamental cage freq.
* fb : ball rotational feq.
* fi : ball pass inner race freq.
* fo : ball pass outer race freq.


### Support Vector Machine
#### Two-Class SVM

* SVM: developed by Vapnik and his co-workers (Vapnik, 2000)
* 커널 함수 Ф(x)를 사용해 original input pattern space (N-dimensional)에서 high dimensional separable feature space(Q-dimensional, Q>N)으로 벡터를 매핑
* 두 개의 데이터셋 사이에 선이나 초평면을 만듦
* 저차원에서 비선형인 문제를 고차원에서 선형 문제로 변환시킬 수 있음
* $$
,\left( {x\_i ,y\_i } \right),,\left( {i = 1,2,...,l} \right),
$$
를 training example이라고 가정하고
$$
x\_i \in R^N
$$
는
$$
y\_i \in \left{ { - 1,1} \right}
$$
에 의해 라벨링 된 클래스에 속함
* 바운더리 H는 다음과 같이 정의됨
$$
w \cdot \Phi \left( x \right) + b = 0
$$
* support vector가 위치한 margin에서 클래스 A와 B의 방정식은 다음과 같음
$$
\eqalign{ & w \cdot \Phi \left( x \right) + b = + 1 \cr & w \cdot \Phi \left( x \right) + b = - 1 \cr}
$$
where vector w defines the boundary
b is a scalar threshold
* 데이터를 가장 잘 나누는 hyperplane은 다음 optimization problem 문제의 solution임(vapnik, 2000)
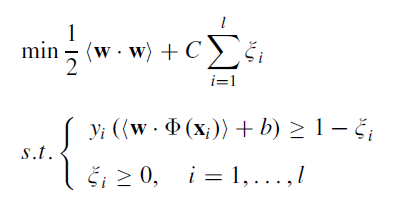 where C is a penalty factor, and it implements a trade-off between empirical risk and confidence interval
coefficient ξ is a slack factor
(이해 못함)
#### Multi-Class SVM
* 처음에는 SVM이 2-class pattern recognition으로 제안됨
* multi-class pattern recognition을 하는 두 가지 방법
* one to one algorithm
* one to rest algorithm: 이 논문에서 사용한 방법 (Yuan and Chu)
$$
\eqalign{ & For,a,data,set,of,k,classes \cr & \left( {x\_i ,y\_i } \right),,,,,,i = 1,2,...,l \cr & x\_i \in R^N \cr & y\_i \in \left{ {1,2,...,k} \right} \cr}
$$
* "one to others" multi-class SVM algorithm:
* k개의 클래스 중에 한 개의 클래스를 하나의 카테고리로 정하고 나머지 k-1개의 클래스를 another category로 정함
그리고 첫 번째 two-class SVM classifier를 SVM1이라고 명명함
* 첫번째로 선택한 클래스를 제외하고 다시 나머지 k-1개의 클래스 중 하나와 그 외의 k-2개의 클래스로 나눔
두번째 two-class SVM classifier를 SVM2로 명명함
* 같은 방법을 계속 반복하고 마지막 two-class SVM classifier를 SVM k-1로 명명함
클래스가 k개일 때 classifier는 k-1개임
* 분류할 때에는 새로운 샘플 x는 SVM에 순서대로 입력됨
SVM1의 결과가 1이면 x는 첫 번째 클래스에 포함시킴
* 이 방법(one to other)은 k-1개의 two-class classifier가 사용됨. 반면에 "one to one" 방법은 k(k-1)/2 단계의 알고리즘이 필요함
### Test Rig

* 3가지의 subsystem: machine set, transducer, data acquisition system
* transducer: accelerometer, signal conditioner로 구성됨, 외륜에서 진동 신호 측정
* sample freq.: 25.6kHz
* 방전 가공으로 인위적 결함 만듦
* 베어링 사양


### Rolling Bearing Fault Diagnosis

* 200개의 진동 신호 데이터셋을 training dataset/Test dataset으로 나눔
* 180개의 training dataset, 20개의 test dataset
* training dataset에서 추출한 feature로 학습시킴
#### Feature Extraction
Hilbert transform을 하기 전에 band-pass filter로 공진 주파수 주변을 필터링함(1000\~5000 Hz)

fr=12
fb = 47.8
fi=51.9
fo=32.1
임펄스가 보이지 않고 shaft rotation freq.가 명확하게 보임

fr=12
fb = 47.8
fi=51.9
fo=32.1


fr=12
fb = 47.8
fi=51.9
fo=32.1
고장 베어링들은 해당 결함 주파수가 명확하게 보임
envelope spectrum에서 local maximum amplitude들을 multi-class SVM input feature vector로 사용함
: A(fr), A(fb), A(fi), A(fo)
#### Fault Pattern Reorganization

* 조건이 4개이므로 3개의 two-class SVM classifier 사용
* SVM1에서 ball fault를 y=+1, other conditions을 y=-1로 정의
SVM2, 3도 같은 방법 수행
SVM3의 결과가 -1이면 normal condition
* RBF kernel parameter \_σ\_는 2로 설정됐고 SVM1, 2, 3은 각각 8, 6, 5개의 support vector를 얻었음

테스트 데이터는 정확도 100%였음
where C is a penalty factor, and it implements a trade-off between empirical risk and confidence interval
coefficient ξ is a slack factor
(이해 못함)
#### Multi-Class SVM
* 처음에는 SVM이 2-class pattern recognition으로 제안됨
* multi-class pattern recognition을 하는 두 가지 방법
* one to one algorithm
* one to rest algorithm: 이 논문에서 사용한 방법 (Yuan and Chu)
$$
\eqalign{ & For,a,data,set,of,k,classes \cr & \left( {x\_i ,y\_i } \right),,,,,,i = 1,2,...,l \cr & x\_i \in R^N \cr & y\_i \in \left{ {1,2,...,k} \right} \cr}
$$
* "one to others" multi-class SVM algorithm:
* k개의 클래스 중에 한 개의 클래스를 하나의 카테고리로 정하고 나머지 k-1개의 클래스를 another category로 정함
그리고 첫 번째 two-class SVM classifier를 SVM1이라고 명명함
* 첫번째로 선택한 클래스를 제외하고 다시 나머지 k-1개의 클래스 중 하나와 그 외의 k-2개의 클래스로 나눔
두번째 two-class SVM classifier를 SVM2로 명명함
* 같은 방법을 계속 반복하고 마지막 two-class SVM classifier를 SVM k-1로 명명함
클래스가 k개일 때 classifier는 k-1개임
* 분류할 때에는 새로운 샘플 x는 SVM에 순서대로 입력됨
SVM1의 결과가 1이면 x는 첫 번째 클래스에 포함시킴
* 이 방법(one to other)은 k-1개의 two-class classifier가 사용됨. 반면에 "one to one" 방법은 k(k-1)/2 단계의 알고리즘이 필요함
### Test Rig

* 3가지의 subsystem: machine set, transducer, data acquisition system
* transducer: accelerometer, signal conditioner로 구성됨, 외륜에서 진동 신호 측정
* sample freq.: 25.6kHz
* 방전 가공으로 인위적 결함 만듦
* 베어링 사양


### Rolling Bearing Fault Diagnosis

* 200개의 진동 신호 데이터셋을 training dataset/Test dataset으로 나눔
* 180개의 training dataset, 20개의 test dataset
* training dataset에서 추출한 feature로 학습시킴
#### Feature Extraction
Hilbert transform을 하기 전에 band-pass filter로 공진 주파수 주변을 필터링함(1000\~5000 Hz)

fr=12
fb = 47.8
fi=51.9
fo=32.1
임펄스가 보이지 않고 shaft rotation freq.가 명확하게 보임

fr=12
fb = 47.8
fi=51.9
fo=32.1


fr=12
fb = 47.8
fi=51.9
fo=32.1
고장 베어링들은 해당 결함 주파수가 명확하게 보임
envelope spectrum에서 local maximum amplitude들을 multi-class SVM input feature vector로 사용함
: A(fr), A(fb), A(fi), A(fo)
#### Fault Pattern Reorganization

* 조건이 4개이므로 3개의 two-class SVM classifier 사용
* SVM1에서 ball fault를 y=+1, other conditions을 y=-1로 정의
SVM2, 3도 같은 방법 수행
SVM3의 결과가 -1이면 normal condition
* RBF kernel parameter \_σ\_는 2로 설정됐고 SVM1, 2, 3은 각각 8, 6, 5개의 support vector를 얻었음

테스트 데이터는 정확도 100%였음